
Bitcoin Analysis App
Bitcoin historical-data analysis with interactive visualizations, descriptive statistics, and simple linear-regression baselines for big-data coursework.
Bitcoin Historical Data Analysis (ITD 105 – Big Data Analytics). I analyzed Bitcoin's price behavior to understand trends, volatility, and relationships among core market variables. The project centered on practical data wrangling, exploratory analysis, simple predictive modeling, and clear visualization for non-technical stakeholders.
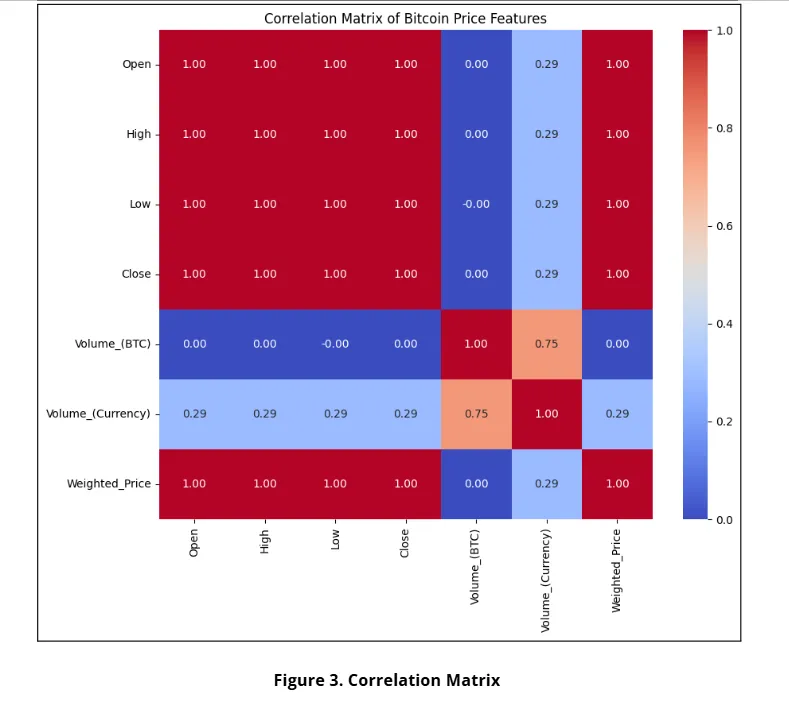
- Visualize trends and correlations across Open, High, Low, Close, Volume, and Weighted Price.
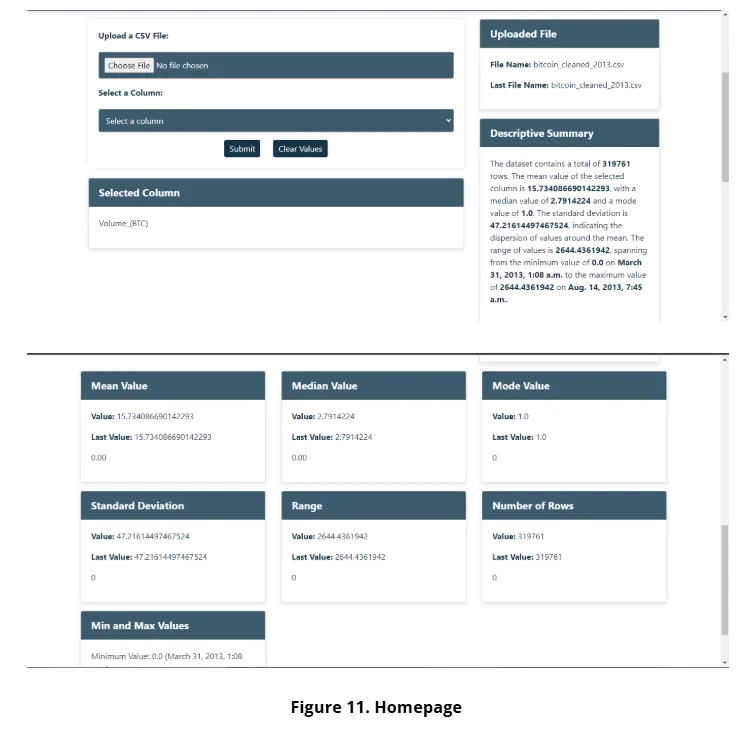
- Compute descriptive statistics (mean, median, stdev, range, min/max & dates).
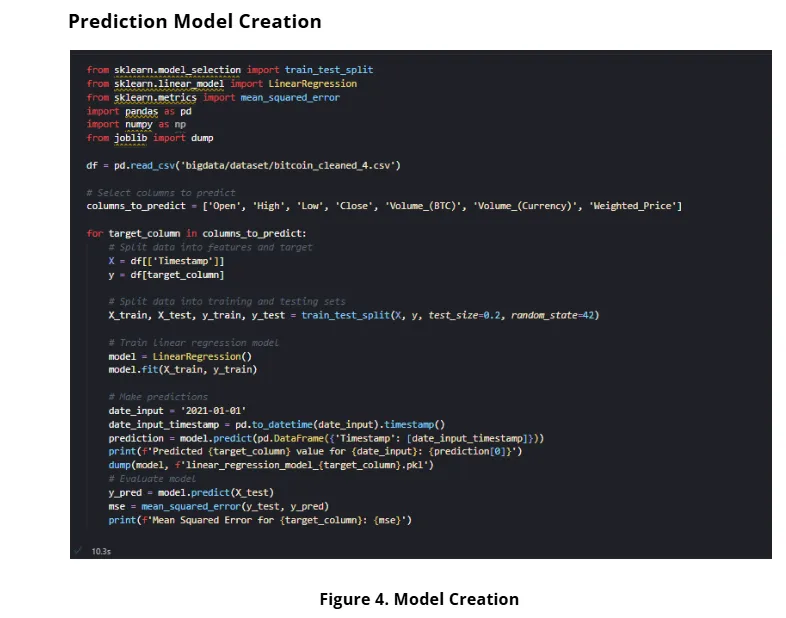
- Build simple linear regression models per target column and evaluate with MSE.
- Cross-check results against a Weka workflow for consistency.
- Translate findings into actionable insights for timing, risk, and strategy.
Minute-by-minute BTC price data (2012–2021) with columns: Timestamp, Open, High, Low, Close, Volume (BTC), Volume (Currency), and Weighted Price. For tractable analysis, I focused on 2019–2021 and also produced daily aggregates to accelerate plotting and time-series inspection.
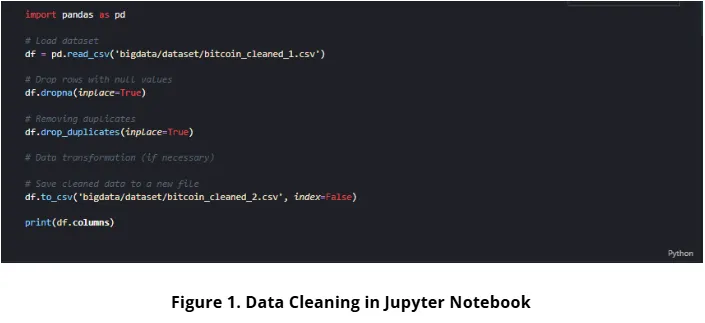
- Removed rows with nulls and duplicates; normalized schema and types.
- Converted Unix timestamps to human-readable dates; derived daily series.
- Split the original multi-year CSV into per-year (and per-month) files for faster I/O.
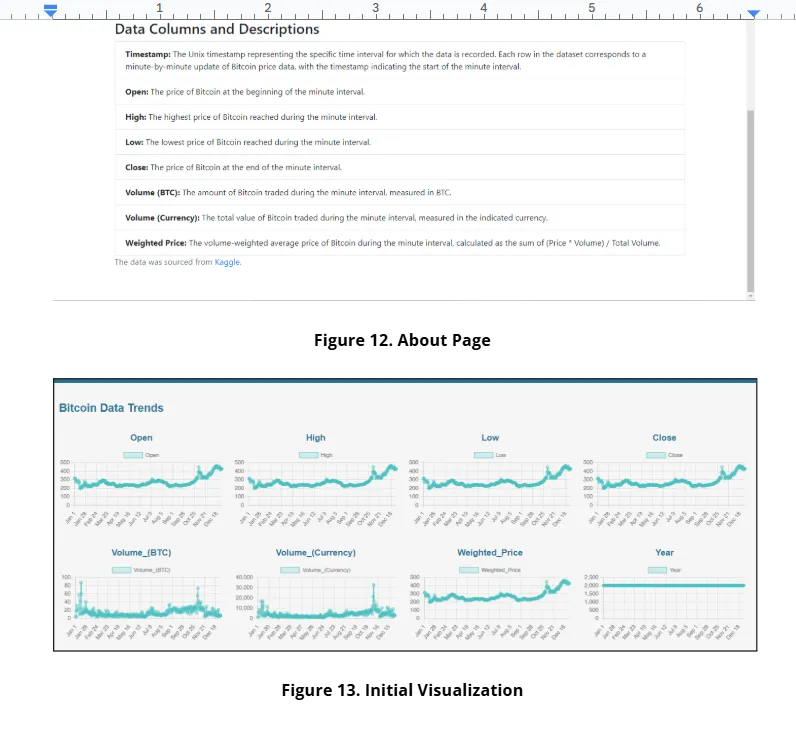
- Documented a lightweight data dictionary to standardize field names & validation.
- EDA: distributions, volatility bands, and pairwise relationships across price columns.
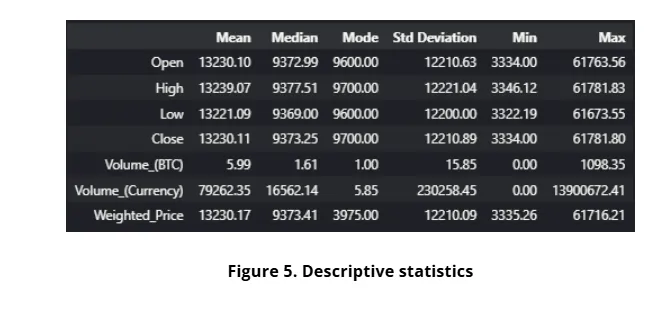
- Descriptive stats to summarize magnitude & spread, highlighting BTC's high variance.
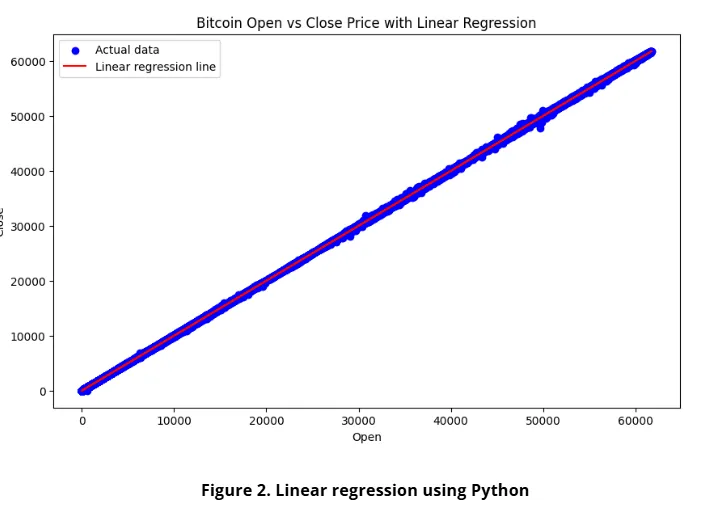
- Simple linear regression per target (e.g., Close, High, Low, Volume); saved models with joblib.
- Evaluation via train/test split and Mean Squared Error; sanity-checked against Weka outputs.
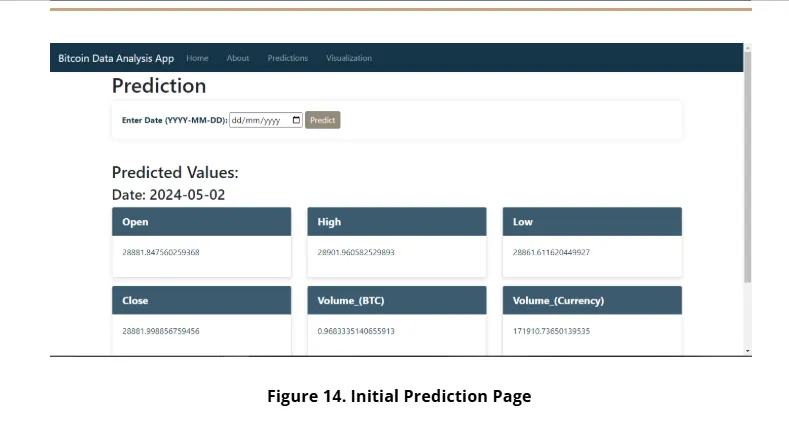
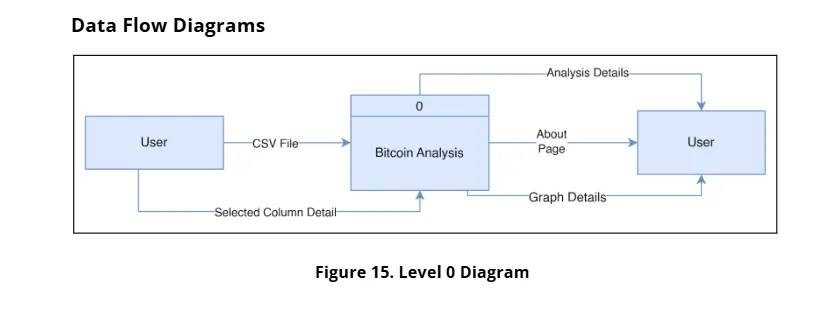
Built a Django-based prototype to run the pipeline and present results on the web. The backend (Pandas, scikit-learn, Matplotlib) ingests CSVs, computes stats, creates predictions for a user-provided date, and exposes context to templates. A clear separation of concerns keeps data loading, processing, and rendering modular.
Rendered time-series charts (per column) and stat cards in the UI. The app prepares JSON-ready arrays for dates and values, then the template draws line charts for quick comparative scanning of Open/High/Low/Close, Volume, and Weighted Price.
- Strong co-movement among price features; descriptive stats confirm large swings typical of BTC.
- Python and Weka pipelines produced aligned regression behavior on held-out data.
- Daily aggregation enabled faster iteration while preserving macro trends for storytelling.
- Scale matters: pre-aggregating and file-splitting dramatically speeds analysis loops.
- Keep a tight data dictionary and validation to avoid subtle schema drift.
- Cross-tool verification (Python ↔ Weka) increases confidence in findings.
- Try better baselines (walk-forward CV, ARIMA/Prophet) and tree/boosting models.
- Add volatility modeling and liquidity signals; integrate confidence bands in charts.
- Ship an interactive dashboard with filterable ranges and exportable insights.